
In this post, I demonstrate how one could use Gelman & Carlin’s (2014) method to analyse a research design for Type S (wrong sign) and Type M (exaggeration ratio) errors, when studying an unknown real effect. Please let me know if you find problems in the code presented here.
[Concept recap:]
Statistical power is the probability you detect an effect, when it’s really there. Conventionally disregarded completely, but often set at 80% (more is better, though).
Alpha is the probability you’ll say there’s something when there’s really nothing, in the long run (as put by Daniel Lakens). Conventionally set at 5%.
Why do we need to worry about research design?
If you have been at all exposed to the recent turbulence in the psychological sciences, you may have bumped into discussions about the importance of a bigger-than-conventional sample sizes. The reason is, in a nutshell, that if we find a “statistically significant” effect with an underpowered study, the results are likely to be grossly overestimated and perhaps fatally wrong.
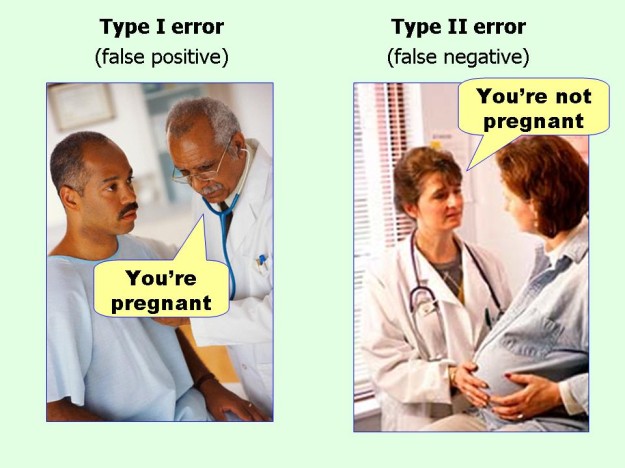
Traditionally, if people have considered their design at all, they have done it in relation to Type 1 and Type 2 errors. Gelman and Carlin, in a cool paper, bring another perspective to this thinking. They propose considering two things:
Say you have discovered a “statistically significant” effect (p < alpha)…
- How probable is it, that you have in your hands a result that’s of the wrong sign? Call this a Type S (sign) error.
- How exaggerated is this finding likely to be? Call this a Type M (magnitude) error.
Let me exemplify this with a research project we’re writing up at the moment. We had two groups with around 130 participants each, and exposed one of them to a message with the word “because” followed by a reason. The other received a succinct message, and we observed their subsequent behavior. Note, that you can’t use the observed effect size to figure out your power (see this paper by Dienes). That’s why I figured out a minimally interesting effect size of around d=.40 [defined by calculating the mean difference considered meaningful, and dividing the result by the standard deviation we got in a another study].
First, see how we had an ok power to detect a wide array of decent effects:
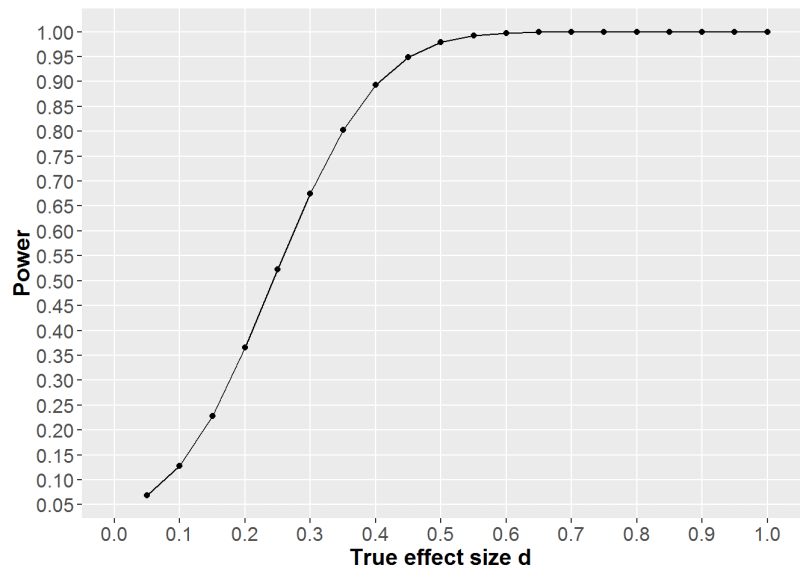
So, unless the (unknown) effect is smaller than what we care about, we should be able to detect it.

Next, above we see that the probability we would observe an effect of the wrong sign would be miniscule for any effect over d=.2. This would mean it’d look like the succinct message worked better than the reason message, when it really was the other way around. 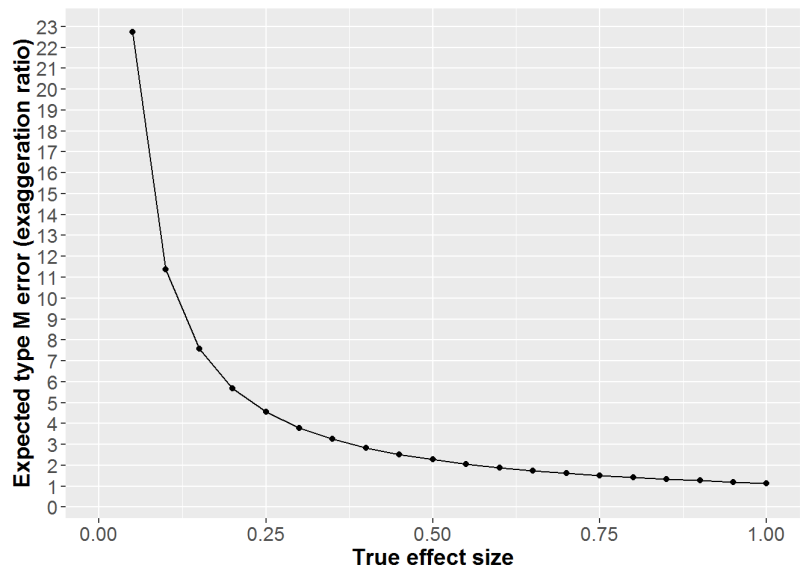
Finally, and a little surprisingly, we can see that even relatively large true effects would actually be exaggerated by a factor of two!
Dang.
But what can you do, those were all the participants we could muster up with our resources. An interesting additional point is brought by looking at the “v-statistic”. This is the measure of how your model compares to random guessing. 0.5 represents coin flipping accuracy (see here for full explanation and the original code I used).

Figure above shows how we start exceeding random guessing at R^2 around 0.25 (d=.32 according to this). The purple line is in there to show how an additional 90 people help a little but do not do wonders. I’ll write about the results of this study in a later post.
Until then, please let me know if you spot errors or find this remotely helpful. In case of the latter, you might be interested in how to calculate power in cluster randomised designs.
Oh, and the heading? I believe it’s better to do as much of this sort of thinking, before someone looking to have your job (or, perhaps, reviewer 2) does it for you.

Thanks for this post. I found it very useful.
One question; For your analysis, you use an effect size that is a “minimally interesting effect size”. Isn’t this against the advice of Gelman & Carlin (2014)? They state, “Determining power under an effect size considered to be of “minimal substantive importance” can also lead to specifying effect sizes that are larger than what is likely to be the true effect.” (p642).
They suggest using “external information (other available data, literature review, and modeling as appropriate to apply to the problem at hand).” (p643). Though to me this too seems like it could lead to the possible effect sizes being exaggerated. For example, if the relevant literature was subject to publication bias.
LikeLiked by 2 people
Good point!
In our case, effect sizes in prior research ranged from ~.20 to ~.70, but we had no chance of whipping up enough participants to study near-zero effects (which, in any case, wouldn’t have been practically significant in the behavior we wanted to change).
So, I’m not sure if we would’ve been better off without calculating the effect size that we actually care about. But it might have been a useless thing to do. What do you think, how does Gelman’s point apply in our case?
ps. found this, when looking for remotely relevant posts to the issue at hand: http://andrewgelman.com/2008/02/12/power_calculati_1/
LikeLike
Knowing what effect size to use is the *really* hard part of these calculations. From my perspective, what you did, i.e. using your previous studies and estimating potential effect size from this, seems like the practically best way to go.
In general, what we ideally want is a lot of raw data on the relevant phenomenon. The key thing is that we need *a lot*, so that we aren’t mislead by small samples, and we also need it to be *raw*, i.e. not summarized and airbrushed and before anyone took out so-called outliers or other inconvenient data points. The trouble is getting lots of raw data on our relevant topics is often really difficult because of the (scandalous) lack of data sharing in science. So then what do we do? Published effects can be misleading because of the very Type M and Type S problems Gelman talks about. Meta-analyses can still be misleading because of publication biases. So, in that case, using one’s own data (provided that it is sufficiently large) seems like maybe the best idea.
Gelman and Carlin (2014) suggest using the literature to determine reasonable potential effect sizes. The examples they use (sex differences in birth rates; shifts in voting preference) both have very extensive literatures that are so heterogeneous that they are not likely to be subject to any one publication bias. But it is easy to come up with examples where things are not so simple.
I think Gelman and Carlin’s paper is great. I just think the determining the potential effects is the really hard part.
LikeLike
There’s still something that escapes me in the reasoning. Say we want to know if a drug lowers some blood marker by x mmol/litre, which has a clinically significant impact on mortality. I’m thinking it might be wise to plan power conservatively, so one could detect a difference of e.g. 0.8x. Consider the “true” effect size unknown.
Now, why would we want to know if the true effect size is e.g. 0.3x, if we only care about clinically significant effects, and are ready to dump the treatment in case the effect is < x? (assume we've planned for sufficiently small interval around x, and are not just looking at the point estimate)
So, why shouldn't one plan power according to a goal, is it about scepticism concerning which goals are meaningful? What am I not getting here?
LikeLike
Interesting post about an important topic. I’ve been playing with the idea of something I pompously called the power inflation index. Maybe you’ll find it interesting:
http://vasishth-statistics.blogspot.de/2015/08/observed-vs-true-statistical-power-and.html
LikeLiked by 1 person
Thanks, looked interesting. Need to get back to that with more thinking time.
LikeLike
[…] tulos olisi todellinen, pieni otoskoko johtaa siihen, että se on todennäköisesti moninkertaisesti liioiteltu. Luvatut lisätutkimuksetkaan tuskin valaisevat käytettyihin menetelmiin liittyviä kysymyksiä […]
LikeLike
[…] Analyse your research design, before someone else does […]
LikeLike
[…] In this post I try to answer the call for increased transparency in psychological science by presenting my master’s thesis. I ask for feedback about the idea and the methods. I’d also appreciate suggestions for which journal it might be wise to submit the paper I’m now starting to write with co-authors. Check out OSF for the Master’s thesis documents and a supplementary website for analyses in the manuscript (I presented the design analysis in a previous post). […]
LikeLike