New paper: From a False Sense of Safety to Resilience Under Uncertainty

Understanding how people act in crises and how to manage risk is crucial for decision-makers in health, social, and security policy. In a new paper published in the journal Frontiers in Psychology, we outline ways to navigate uncertainty and prepare for effective crisis responses.

The paper is part of a special issue called From Safety to Sense of Safety. The title is a play on this topic, which superficially interpreted can lead to a dangerous false impression: that we ought to intervene on people’s feelings instead of the substrate from which they emerge.

Nota bene: In June 2024, this topic is part of an online course for the New England Complex Systems Institute, and have some discount codes for friends of this blog. Do reach out!

The Pitfall of a False Sense of Safety

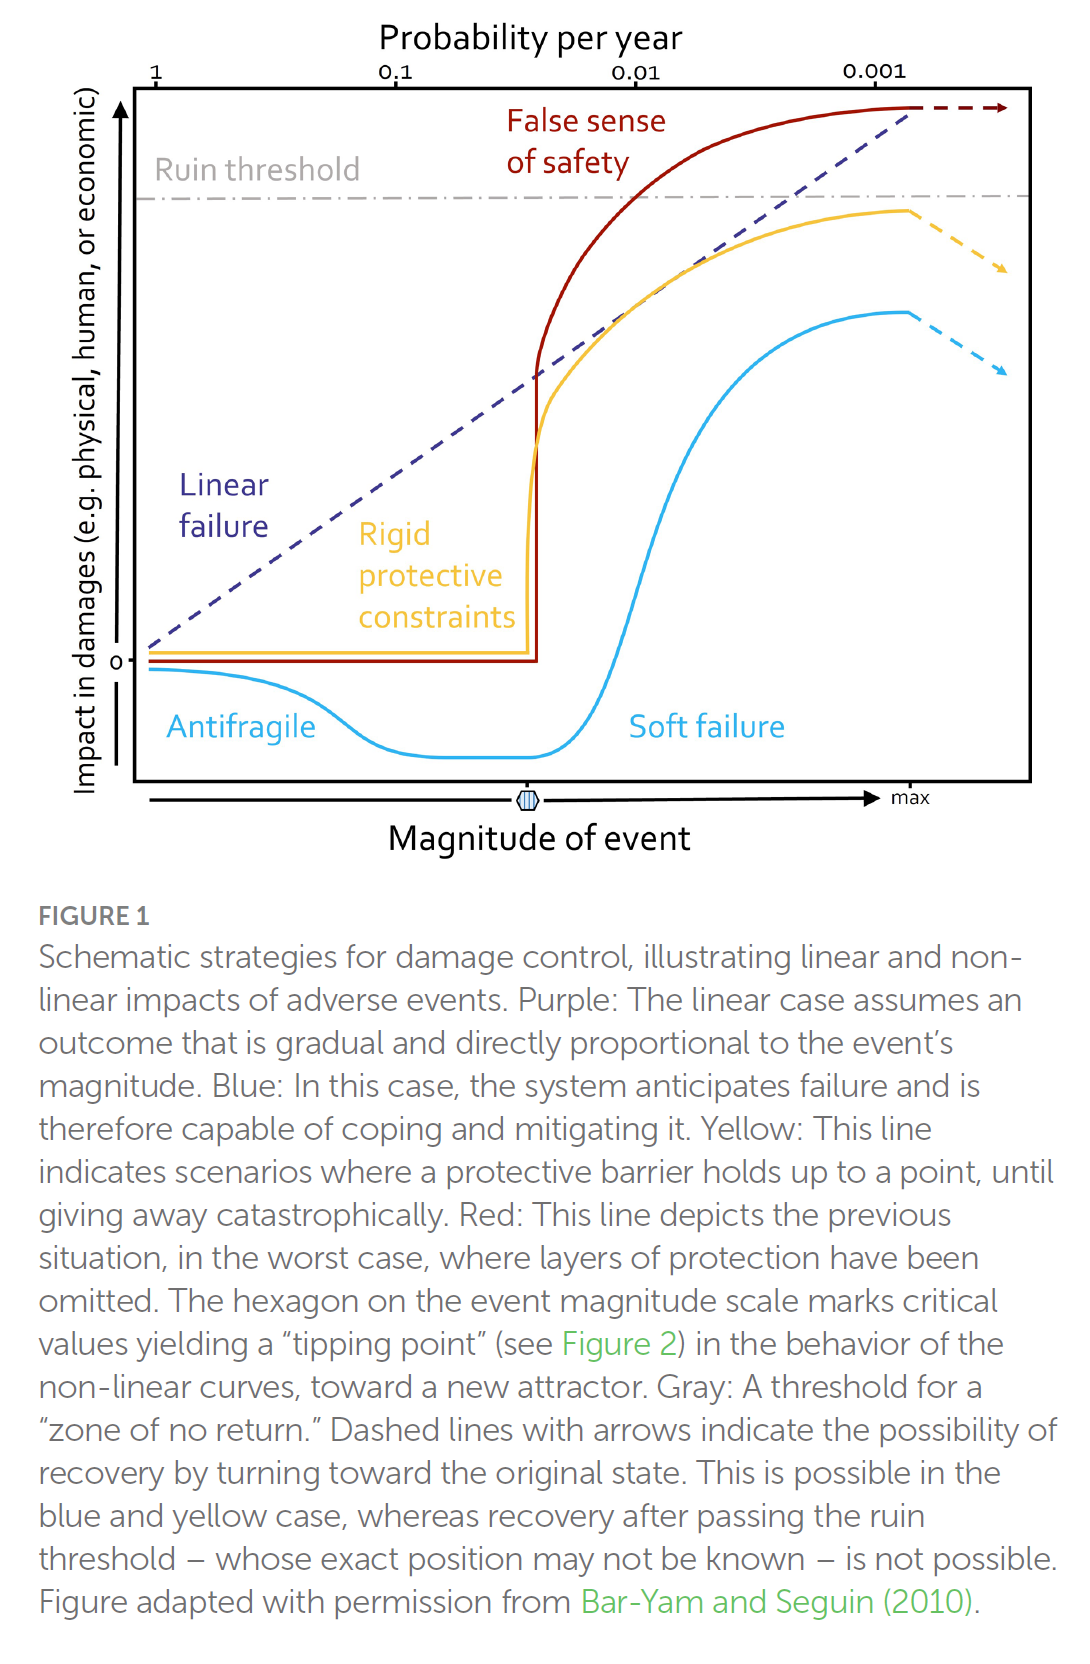
In the paper we first of all argue that we should understand so-called disaster myths, a prominent one being the myth of mass panic. This refers to the idea that people tend to lose control and go crazy during crises when they worry or fear too much, which implies we need to intervene on risk perceptions. But in fact, no matter what disaster movies or news reports show you, actual panic situations are rare. During crises, people tend to act prosocially. Hence, decision-makers should shift their focus from mitigating fear and worry – potentially leading to a false sense of safety – towards empowering communities to autonomously launch effective responses. This approach fosters resilience rather than complacency.

Decision Making Under Uncertainty: Attractor Landscapes

Secondly, we represent some basic ideas of decision making under uncertainty, via the concept of attractor landscapes. I now hope we would’ve talked about stability landscapes, but that ship already sailed. The idea can be understood like this: Say your society is the red ball, and each tile a state it’s in (e.g. “revolt”, “thriving”, “peace”, etc.) The society moves through a path of states.

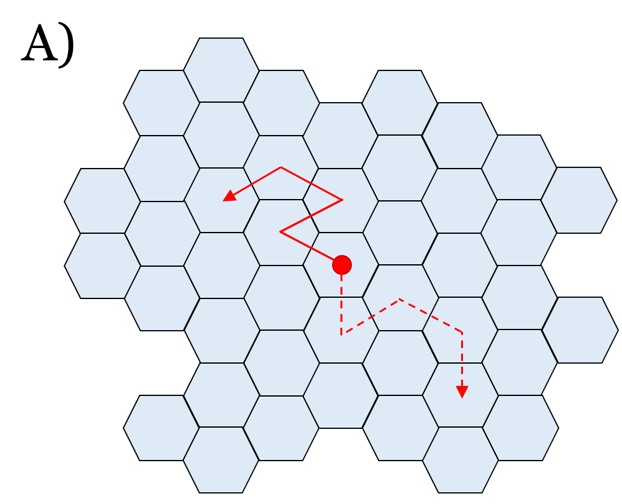
These states are not equally probable; some are more “sticky” and harder to escape, like valleys in a landscape. These collections of states are called attractors. The area between two attractors is a tipping point (or here, kind of a “tipping ridge”).

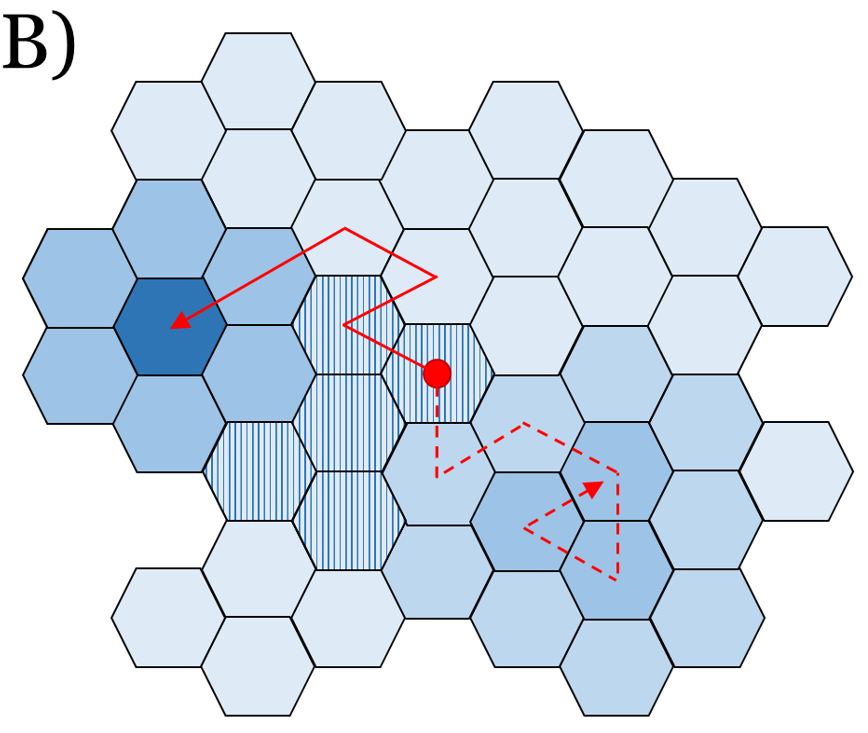
I wholeheartedly encourage you to spend five minutes on Nicky Case’s interactive introduction to attractor landscapes here. It’s truly enlightening. The main thing to know about tipping points: as you cross them, nothing happens for a long time… Until everything happens at once.

The Dangers of Ruin Risks

All attractors are not made equal, though. For some, when you enter, you’ll never escape. These are called “ruin risks” (orange tile). If there is possibility of ruin in your landscape, probability dictates you will eventually reach it, obliterating all future aspirations.

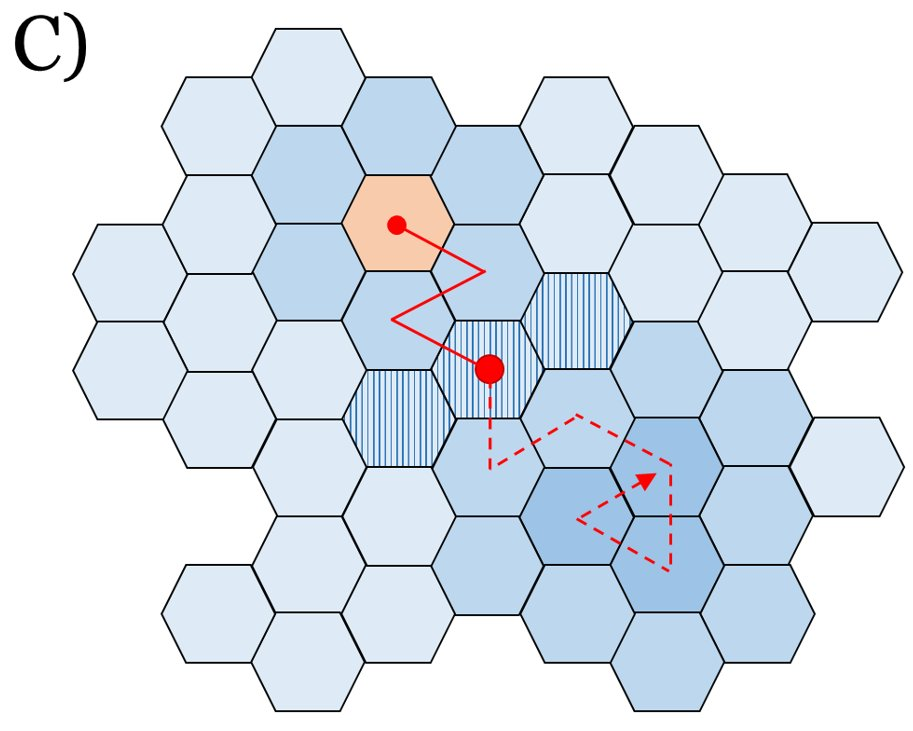
As a basic principle, it does not make sense to see how close to the ledge you can walk and not fall. In personal life, you can take ruin risks to impress your friends or shoot for a Darwin Award. But keep your society away from the damned cliff.

As Nassim Nicholas Taleb teaches us: Risk is ok, ruin is not.

Navigating the Fog of War

In reality, not all states are visible from the start. Policymakers often face a “fog of war” (grey areas). Science can sometimes highlight where the major threats lie (“Here be Dragons”), but the future often remains opaque.

To make things worse for traditional planning, as you move a step from the starting position, the tiles may change. So you defined an ideal state, a Grand Vision (yellow) and set the milestones to reach it? If you remain steadfast, you could now be heading at a dead end or worse. Uh-oh.

(nb. due to space constraints, this image didn’t make it to the paper)

This situation, described in Dave Snowden’s Cynefin framework, is “complex.” Here, yesterday’s goals are today’s stray paths, so when complexity is high, you focus on the present – not some imaginary future. The strategy should be to take ONE step in a favourable direction, observe the now-unfolded landscape, and proceed accordingly.

The Cynefin Framework and Complex Systems

Sensemaking is a motivated, continuous effort to understand connections (which can be among people, places, and events) in order to anticipate their trajectories and act effectively.

Gary Klein

Sensemaking (or sense-making, as Dave Snowden defines it as a verb) refers to the attempt or capacity to make sense of an ambiguous situation in order to act in it. This is what we must do in complex situations, where excessive analysis can lead to paralysis instead of clarity.

Cynefin is a sense-making framework designed to enable conversations about such a situation, and offers heuristics to navigate the context. In the paper, we propose some tentative mappings of attractor landscape types to the Cynefin framework.

In general, our paper offers proposals for good governance, drawing from the science of sudden transitions in complex systems. Many examples pertain to pandemics, as they represent one of the most severe ruin risks we face (good contenders are of course wars and climate change).

By understanding the concepts illustrated here, policymakers could better navigate crises and build resilient societies capable of adapting to sudden changes.

If you want a deeper dive, please see the paper discussed in this post: At-tractor what-tractor? Tipping points in behaviour change science, with applications to risk management

NOTE: There’s another fresh paper out, this one in Translational Behavioural Medicine: How do behavioral public policy experts see the role of complex systems perspectives? An expert interview study. Could be of interest, too!

Coronavirus, lifestyle diseases and the Shadow Mean

In this post, I introduce fat-tailed distributions and the concept of the Shadow Mean, with implications to how seriously multiplicative events should be taken in the society. [Addendum: If you want a technical treatment of the proper Shadow Mean approach instead of my caricature, see this]

I keep getting struck by how often we see well-meaning educated people comparing phenomena such as terrorism and epidemics to the “as much or more” dangerous lifestyle diseases. I even saw one of the smartest health psychologists I know commit this error in their professorial inauguration speech. Note, that I’m not against preventing non-communicable diseases; in fact, that’s what my dissertation is about. But we need to be vigilant on how risks work.

Here’s a chart from the aforementioned presentation, where you can clearly see that, all else equal, we should be diverting almost all our prevention resources to the biggest killers, which are lifestyle diseases:

Rik causes of death

The problem is, that all else is not equal. Why?

It has to do with a concept called “Shadow Mean” (capitalised for ominosity), which relates to “fat tailed” distributions. I’ll explain more later.

But let us first consider some properties of the Coronavirus pandemic, and how they differ from the common flu – and, by extension, to lifestyle diseases. To do so, I’ll give the floor to Luca Dellanna (Twitter, website), who kindly contributed his thoughts to this blog:


Luca Dellanna: Six unintuitive properties of the current pandemic

1/6: Asymmetry (part I)

“The cost of paranoia is bounded. The sooner we get paranoid, quicker we can get a handle on things, sooner we can confidently go back to business as usual the cost of “letting it happen” is unbounded. Here is the tradeoff in the US: Restrict international travel now and maintain our ability to move freely domestically or keep the flows coming and inevitably have to restrict movement both internationally and domestically. The choice is clear.” – Joe Norman (link)

There is enough evidence that the pandemic is inevitable. The only question is how big and how fast we want it.

The costs of preventing the pandemic are mostly linear. Closing down schools today for one month costs roughly as much as closing them for one month in April. Closing down 3 schools costs roughly half as closing down 6 (assuming the same size).

Instead, the costs of letting the pandemic grow are nonlinear.

Letting the pandemic run today might mean 100 more people infected tomorrow. Letting the pandemic run next week might mean 1000 more people infected the following day.

And it gets worse (see the next point).

2/6: Nonlinearities

“In the US, we have 2.3 million people in prison. I cannot imagine a way to stop #coronavirus from spreading like wildfire among that population. How will federal, state, & local authorities handle this?” – Jon Stokes (link)

Another example of the non-linear consequences of the pandemic.

A pandemic that “knocks-off” (i.e. prevents from working, for any reason) 0.1% of the workforce is bad but not that bad.

A pandemic that “knocks-off” (i.e. prevents from working, for any reason) 0.1% of the workforce in a clustered way is much worse: it means that some companies lose a large percentage of their workforce for a few days or weeks and must close the operations (whereas others are directly unaffected).

A pandemic that “knocks-off” (i.e. prevents from working, for any reason) 0.2% of the workforce is ten times worse than a 0.1% pandemic – for there are less workers to covers those who are sick, for one company closing creates problems downstream the supply chain, and so on.

The worst case is so bad that it makes sense planning for it even if it has low chances to happen (which is itself a strong assumption on too uncertain variables).

3/6: Impact

“The difference between the flu and the coronavirus is that between a tide and a tsunami. The same amount of water, but the impact is different because the tsunami arrives all at once.” – Roberto Burioni (link)

As I explained on Twitter, the problem is not (only) the current mortality, but the mortality we can get if our healthcare system gets overwhelmed. People won’t receive the care they need, even for conditions unrelated to the coronavirus.

“If a juggler can juggle 4 balls letting them drop 1% of time,  then he can also juggle 10 balls letting them drop 1% of time.” – this is how most people estimate mortality. As if healthcare was a fully elastic system.

4/6: Asymmetry (part II)

“Asymmetry. Convex decision. So long as there is no risk of harm from masks & disinfectants, the decision is wise, in spite of the absence of evidence– Nassim Nicholas Taleb (link)

Face masks do not offer full protection, but they do offer some protection. As long as you remove them carefully and they don’t make you sweat (so that you’re tempted to touch your face), they’re better than nothing.

Their cost is minimal and bounded, their benefit is large and unbounded (at least for you: they might save your life).

Of course, there is the argument that face masks are finite and they should be allocated where they’re the most needed. It’s a valid argument. But let’s focus on the asymmetry of the cost-benefit, because it applies to another method as well: washing hands and disinfecting.

Their cost is extremely low. I’m baffled that so few people are doing it first thing while arriving home.

Don’t be penny-wise but pound-foolish with your time.

5/6: Testing

“True epidemic in Iran and South Korea, community spread in Italy, confirmed transmission from Iran to multiple countries, the US basically isn’t testing anybody… and as far as I can tell it’s gauche even to mention [the virus] in public in the United States.” – @toad_spotted (link)

If a country doesn’t like to talk about a problem, it will have to talk about that problem.

Problems grow the size they need for you to acknowledge them.
The virus is already here, it’s just not evenly detected. – Balajis Srinivasan (link)

6/6: Infection

“I just realized that when people say ‘yeah but you won’t die’ they mean ‘yeah you’ll become a carrier and make everyone you see sick but not die’.” – Paul McKellar (link)

There are many replies to “the coronavirus is not that mortal”.

  • “15% mortality in older people (80+ years old) almost means a Russian Roulette if they get infected”.
  • One’s chances of dying depend on the number of infected people he meets in his day-to-day (because the more he meets, the more the chances he gets the virus).
  • We don’t know! There are many reasons that prevent us from pinpointing the mortality of the virus in a way that is predictive of the future. We should assume the worst scenarios until we can rule them out. (Why? Because asymmetry and nonlinearities; the content of points #1 and #4 above.)

Luca

[Luca’s newsletter is pretty much the only one I’ve ever found positively thought-provoking; if you want to hear more of his ideas, subscribe here]


Horizontally challenged tails

What does this have to do with lifestyle diseases? Well, while the incidence of the common flu is quite unlikely to quadruple from one year to the next, it is much, much less likely, that the incidence of e.g. cardiovascular disease would do the same.

Let’s look at an example. In the left plot below, you see what a mortality rate from a fat tailed distribution would look like. There are two years, when you have an extreme case – something psychologists are used to just eliminating from the data. Note, that outliers are different from extremes; an outlier may be a badly measured observation, whereas an extreme lies within the conceivable boundaries of the phenomenon.

fat and thin tails
Figure by me; code available here

The left plot could signify a viral epidemic. Say we are living year 26; the mean observed annual mortality would be around 900, and you probably aren’t too worried; things are almost exclusively very calm. But, given the fat-tailed distribution, extreme values are possible and upon surviving year 27, the mean would be almost 6000. Before it’s seen, this is known as the Shadow Mean; there are yet unobserved cases we can infer from the mechanics that produce the fat-tailed distribution, but which are not (yet) observed empirically.

Contrast the situation with that on the right plot, which could signify deaths from accidents in a country like Finland. In 900 years, we still have not observed one with over 2500 deaths (nb. this is just simulated data from a thin-tailed distribution). The mean is about 1000 and if we omit the maximum observation, it remains practically identical.

lawnmowers
Figure by Stefan Gasic; see his work here!

N-th order matters

Time and second-order effects – that is, things that happen as an indirect consequence of an event – are of great importance when something extreme happens. Let us run a small scenario. Finland has 5½ million people. Let us consider that 25% would get infected (with a maximum of, say, 50%), and 5% (max. 20%) would require care in a hospital. This would already mean, that we would suddenly have 70 000 (max 550 000) extra patients in the healthcare system, which has been “streamlined” for years. Very different scenario than having the same number of extra patients over the course of a year or a decade – one, which lays fertile ground to second-order effects. These include the impact on people, who wouldn’t have big problems under normal situations, due to having hospital care capacity readily available.

Finally: This is not fearmongering or a call for hysteria. Cold-headed rational decision making calls for taking precautions here. If you stock up so that you can self-quarantine yourself for 14 days in the case of getting ill, and do it gradually by buying little extra every time you go to the store anyway, you are making a good decision. Here’s one more figure by Luca, illustrating the point:

Image
Figure by Luca Dellanna; source

Relevant resources and references: